Graphing Linear Inequalities
Use the following procedure to graph a linear inequality in two variables.
Procedure —
To Graph a Linear Inequality in Two Variables
Step 1 Graph the equation that corresponds to the given inequality.
• If the inequality symbol is ≤ or
≥, use a solid line to show that
points on the line are solutions of the inequality.
• If the inequality symbol is < or >, use a dotted line to show
that points on the line are not solutions of the inequality.
Step 2 Use a test point NOT on the line to determine the region
whose points satisfy the inequality.
Step 3 Shade the region whose points satisfy the inequality.
Example 1
Graph the inequality 2x - y < 4.
Solution
Step 1 Graph the equation that corresponds to the given inequality.
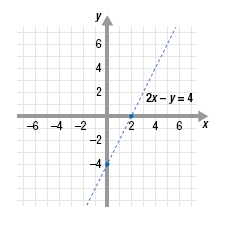
Graph the equation 2x - y = 4.
To do this, substitute 0 for y and solve for x to get the x-intercept, (2, 0).
Next, substitute 0 for x and solve for y to get the y-intercept, (0, -4).
Then, plot the points.
Since the inequality symbol “<†does not contain “equal to,†draw a
dotted line through the plotted points.
The dotted line shows that points on the line are not solutions of the
inequality.

Step 2 Use a test point NOT on the line to determine the region whose
points satisfy the inequality.
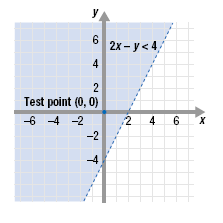
The point (0, 0) is not on the line, so it can be used as a test point.
| Substitute 0 for x and 0 for y.
Simplify. |
Is Is |
2(0) - 0 0 |
< 4 ?
< 4 ? Yes |
Since 0 < 4 is true, the ordered pair (0, 0)
is a solution of the inequality 2x - y < 4.
This means all the points in the region containing (0, 0) are solutions.
Step 3 Shade the region whose points satisfy the inequality.
Shade the region that includes (0, 0). This is the region above the dotted
line.

Note — Using (0, 0) as a Test Point
If the point (0, 0) does not lie on the line, it is a good test point since
it often makes the calculations easier.
|