|
TUTORIALS:
|
Graphing Exponential Functions
To graph an exponential function, we use the same procedure that we used
to graph other functions. That is, we calculate points and then plot them.
Example
Graph f(x) = 2x.
Solution
Step 1 Make a table of ordered pairs.
Since the domain of an exponential function is all real numbers,
we can select any values we want for x and then calculate the
corresponding values for f(x). We will let x be integers from -3 through 3.
|
x |
f(x) = 2x |
(x, y) |
|
-3 |
 |
 |
|
-2 |
 |
 |
|
-1 |
 |
 |
|
0 1
2
3 |
f(0) = (2)0 = 1 f(1) = (2)1 = 2
f(2) = (2)2 = 4
f(3) = (2)3 = 8 |
(0, 1) (1, 2)
(2, 4)
(3, 8) |
Note:
We often use the variable y and the
function notation f(x) interchangeably.
So, f(x) = 2x can also be written
as y = 2x.
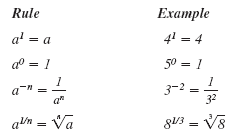
Here’s a reminder of some exponent rules:

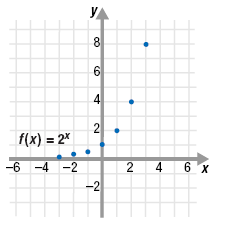
Step 2 Plot the ordered pairs.
The points are shown on the graph.

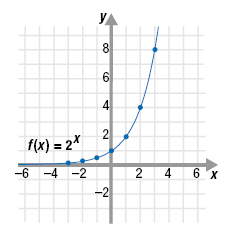
Step 3 Sketch a smooth curve through the plotted points.
The smooth curve represents all the ordered pairs that satisfy
f(x) = 2x.

The x-axis is a horizontal asymptote. That is, the graph of f(x) = 2x approaches, but never reaches, the x-axis.
|